Trending Now
Recommended for you
0
Your favorites
0
About us
English
English
Español
中国
Log in with Facebook
Nothing found.
New recommendations for you:
Click on a
button to see recommendations based on your taste!
intel's diversity report shows slow growth for women and minorities
business
diversity
diversityreport
employment
engadget
gear
graphs
intel
krzanich
minorities
report
techindustry
women
source
oscar-nominated films perfectly explained in graphs
academy awards
charts
film
graphs
oscars
technology
source
a vintage chart of ufo sightings from around the world
charts
graphs
source
lifestyle
uh, here's how often people re-wear their clothes between washes
features
graphs
health fitness
poll
technology
info
source
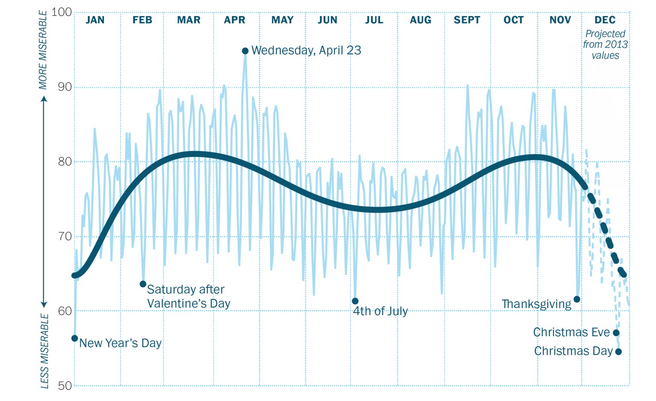
charts show when we're at our most miserable during the year
misery
data
data visualization
google trends
graphs
happiness
misery index
science
science fiction
trends
visualizations
source
the top 100 billboard songs of all time, graphed
charts
graphs
music
technology
source
these simple tips will make your science visualizations rock
charts
data visualization
graphs
plots
science
science fiction
scientific method
scientific visualizations
visualizations
source
charts explain why brunch is the worst
art
charts
food and drink
graphs
pics
technology
source
the most (and least) obscure hit songs of the last 114 years, graphed
charts
graphs
maths
music
science fiction
songs
source
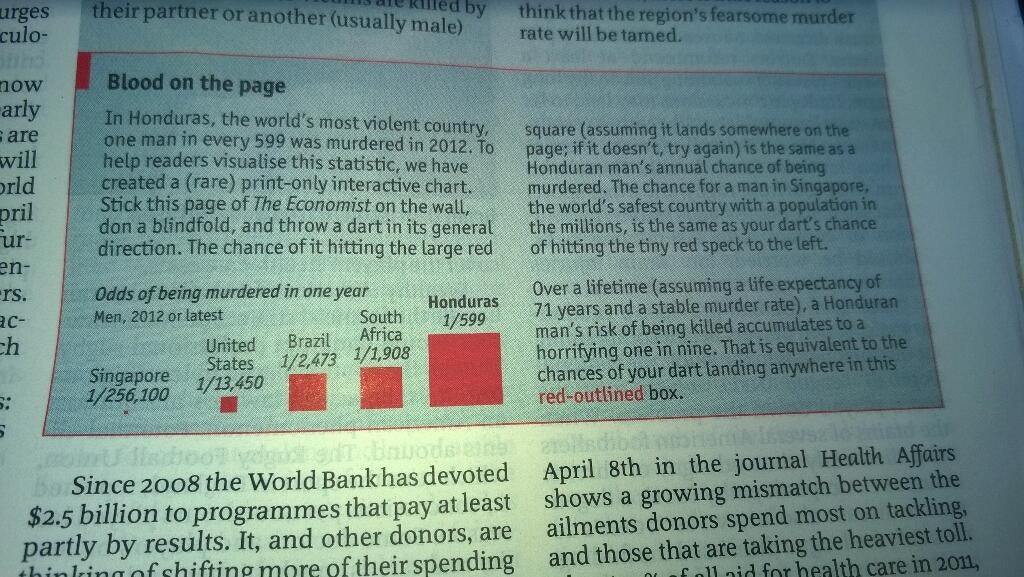
what's your risk of being murdered? find out with a game of darts.
charts
datavisualization
graphs
murder
science fiction
sociology
the economist
source
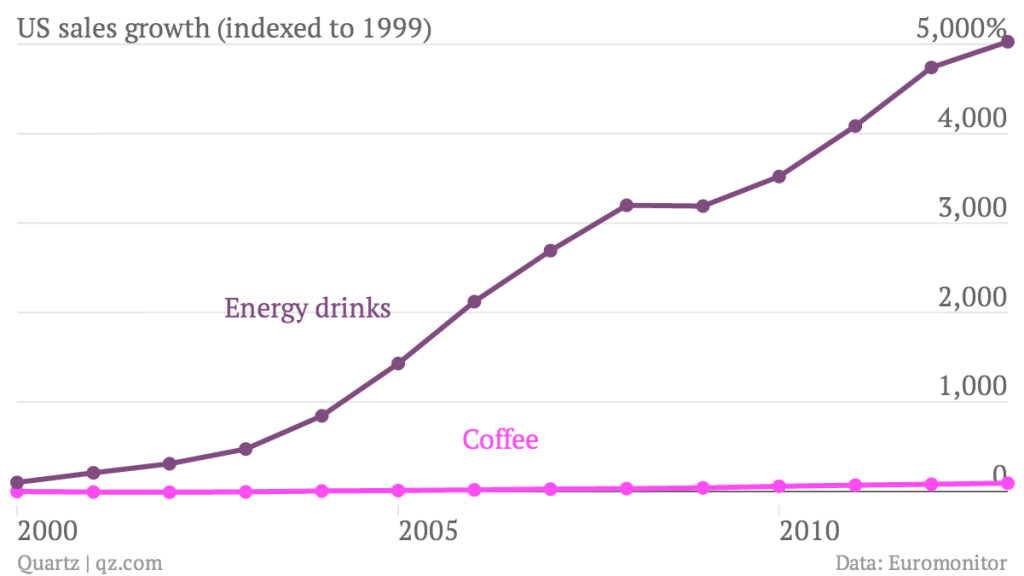
energy drink sales are insane, but they won't crush coffee. here's why.
coffee
data visualization
dataviz
energy drinks
food science
futurism
graphs
science fiction
soda
source
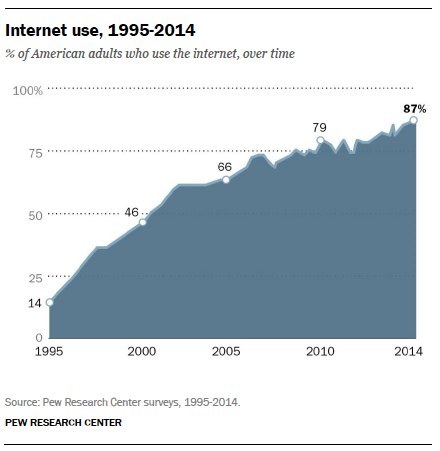
(via summary of findings | pew research center’s internet...
charts
graphs
internet use
newspaper
pew internet project
research
stats
source
(via more people around the world have cell phones than ever had...
graphs
newspaper
phones
quartz
source
"simple, right? except this graph doesn’t tell that story,...
graphs
income inequality
newspaper
one percent
source
the secrets of a memorable infographic
chart junk
charts
data visualization
design
evidence
graphs
harvard
infographics
memory
michelle borkin
school of engineering and applied sciences
science
source
visualizing the most unisex names in u.s. history
charts
data visualization
datasivualizations
gender
graphs
names
science fiction
unisex names
source
Show Previous
Show More