Trending Now
Recommended for you
0
Your favorites
0
About us
English
English
Español
中国
Log in with Facebook
Nothing found.
New recommendations for you:
Click on a
button to see recommendations based on your taste!
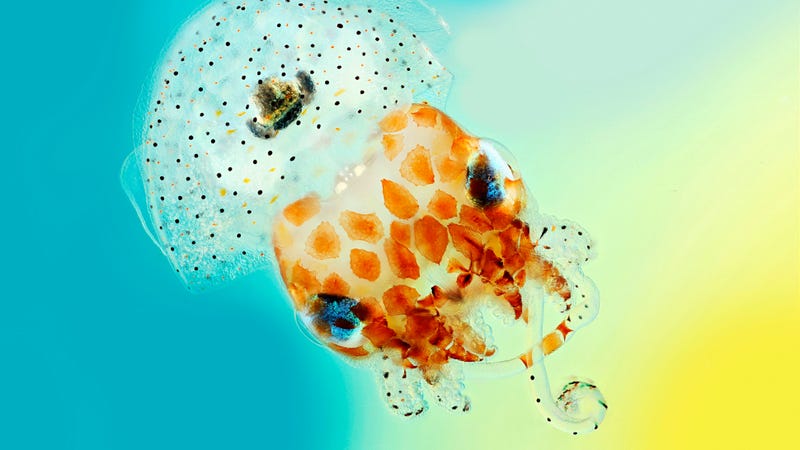
this year's best science photos are so good they're basically art
awards
image awards
photography
science
science visualizations
technology
visualizations
wellcome trust
wellcome trust image awards
source
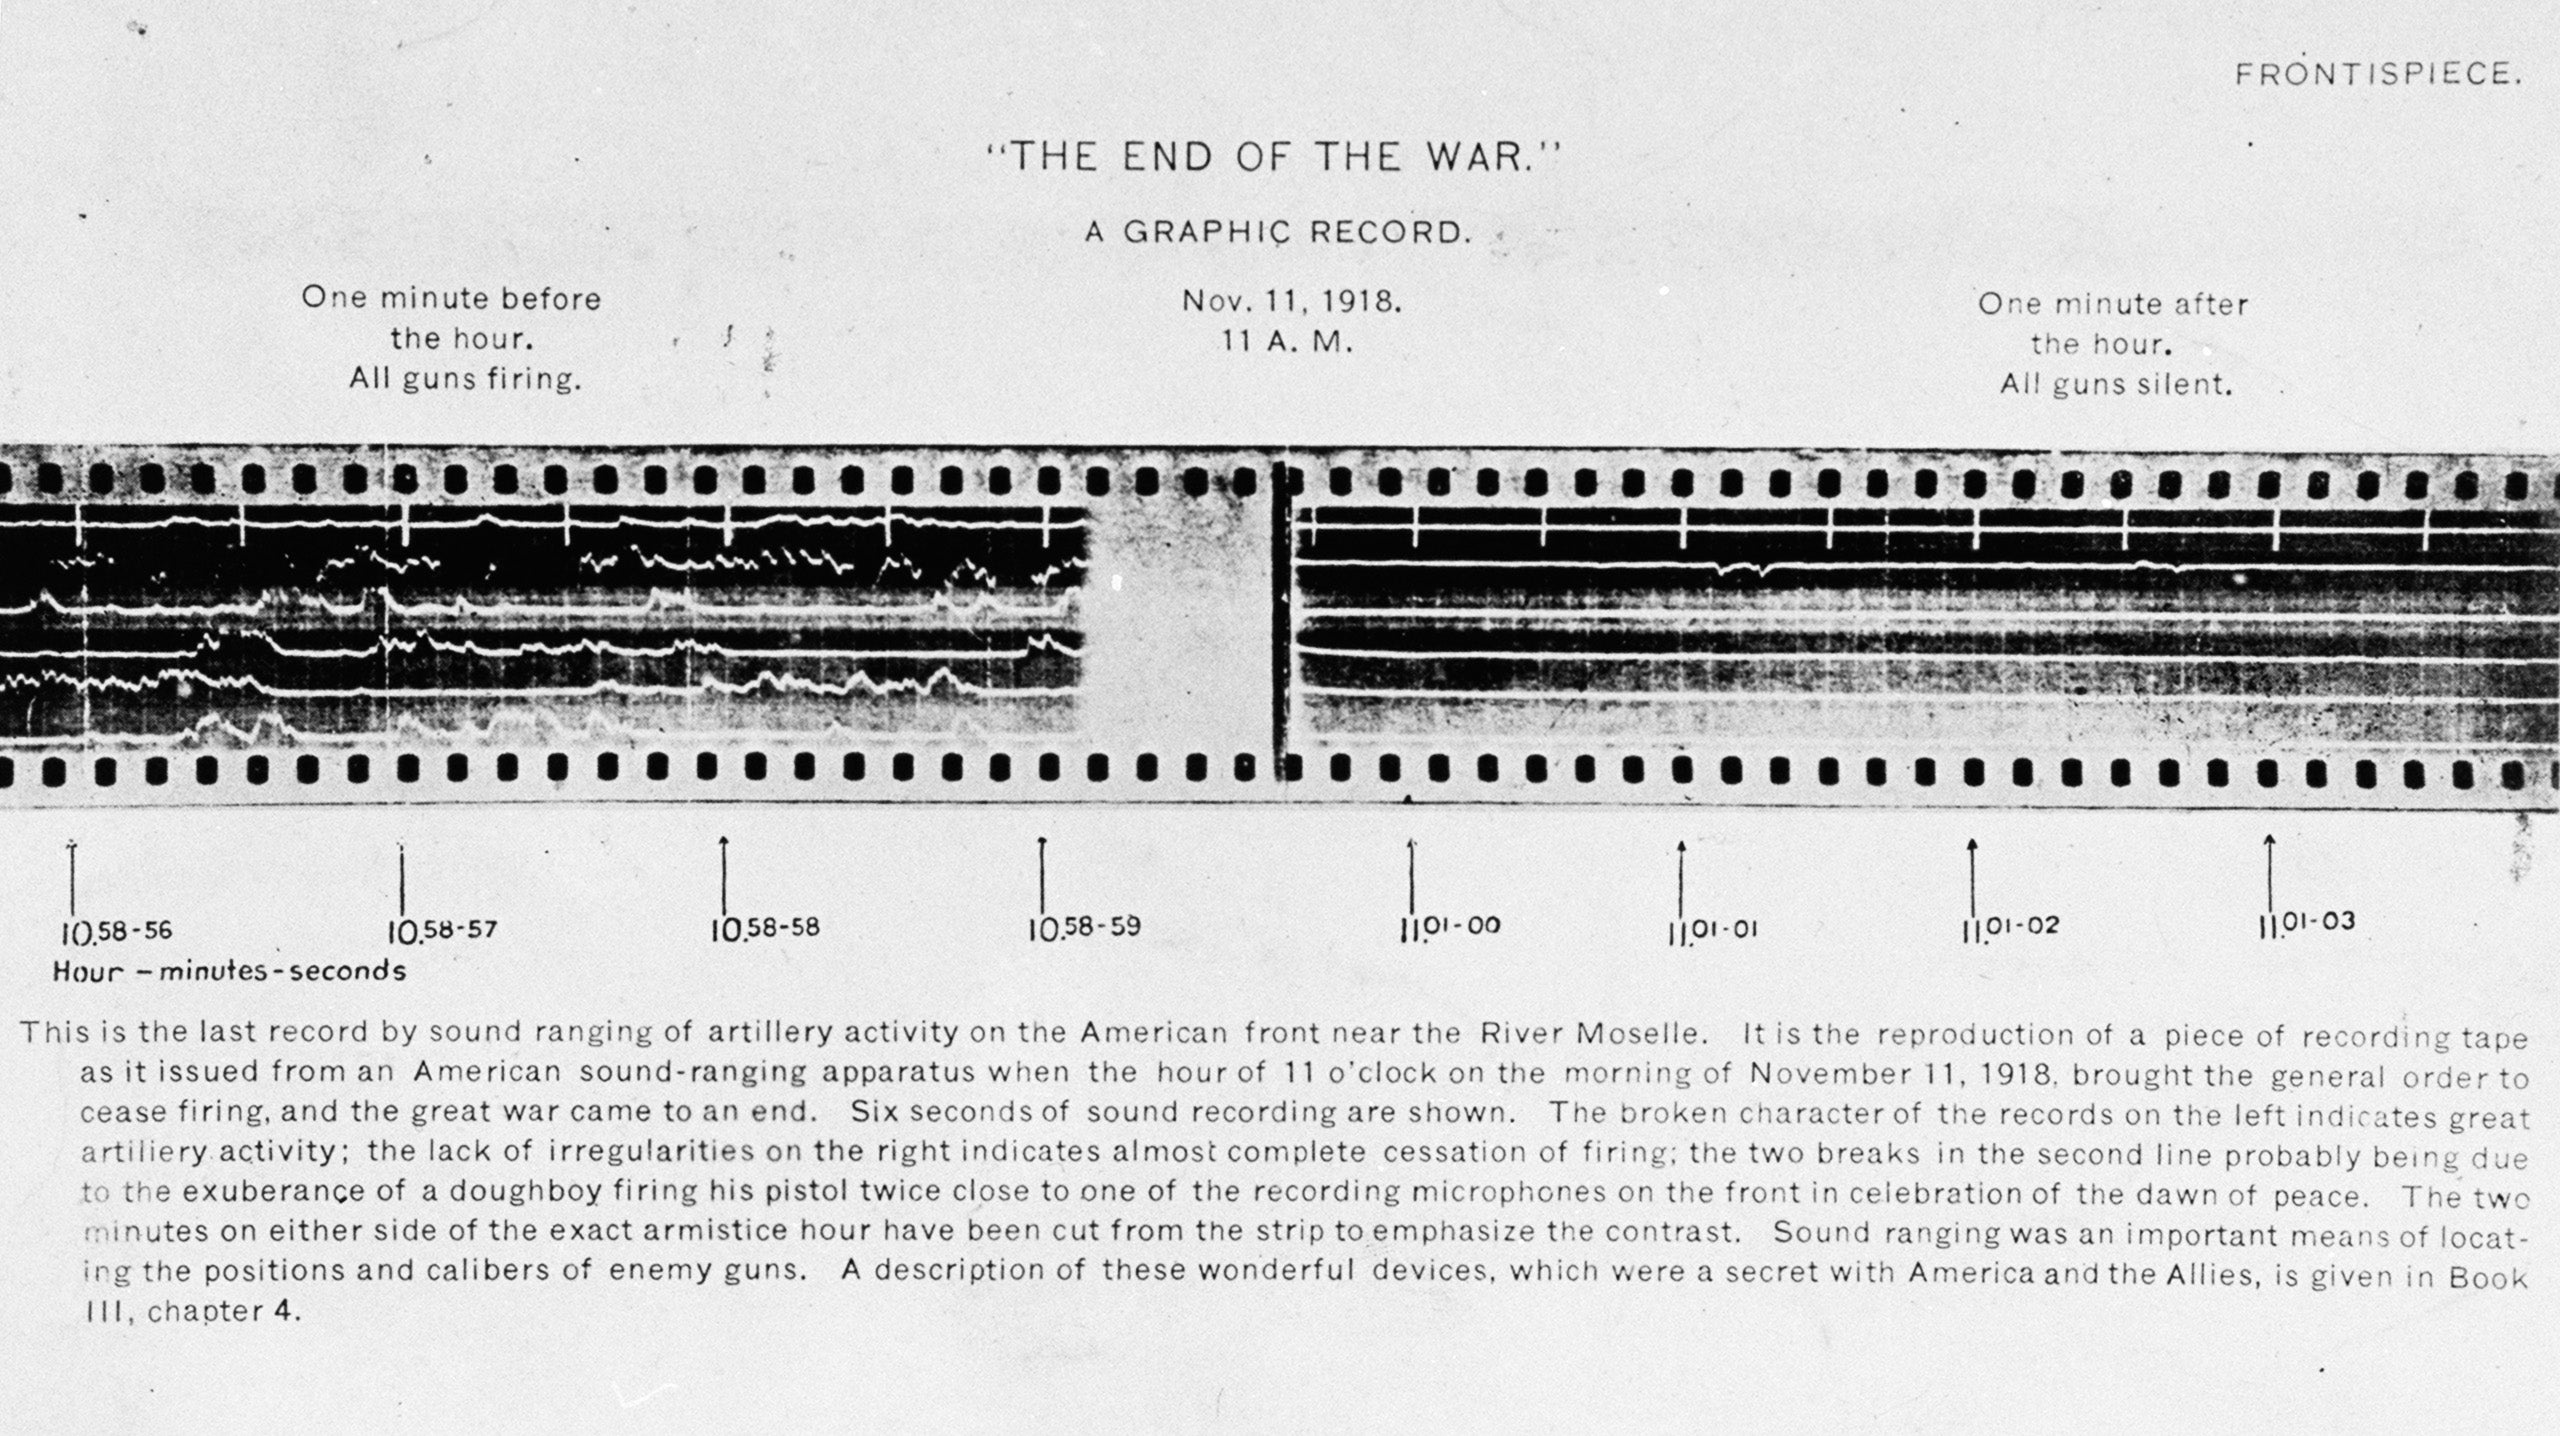
the sound of a war's end, visualized
data visualization
technology
visualizations
war
world war i
source
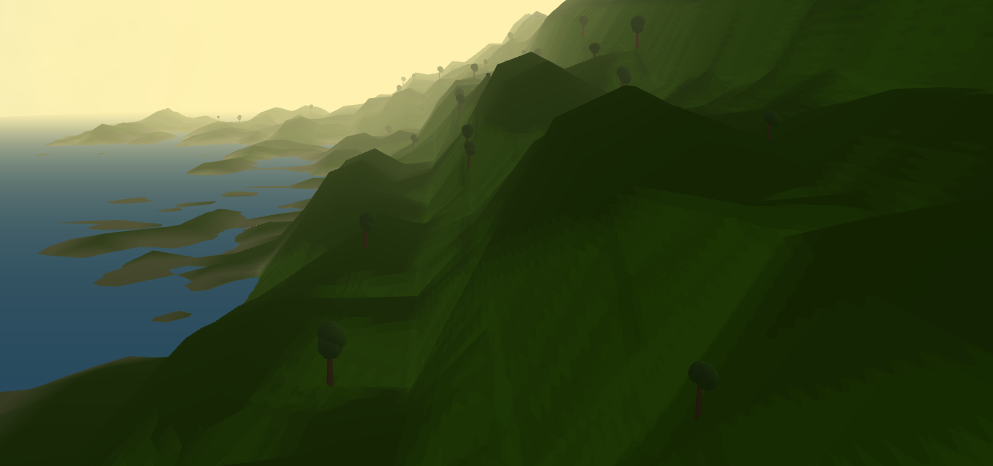
watch your music create a constantly changing landscape
data
music
technology
visualizations
source
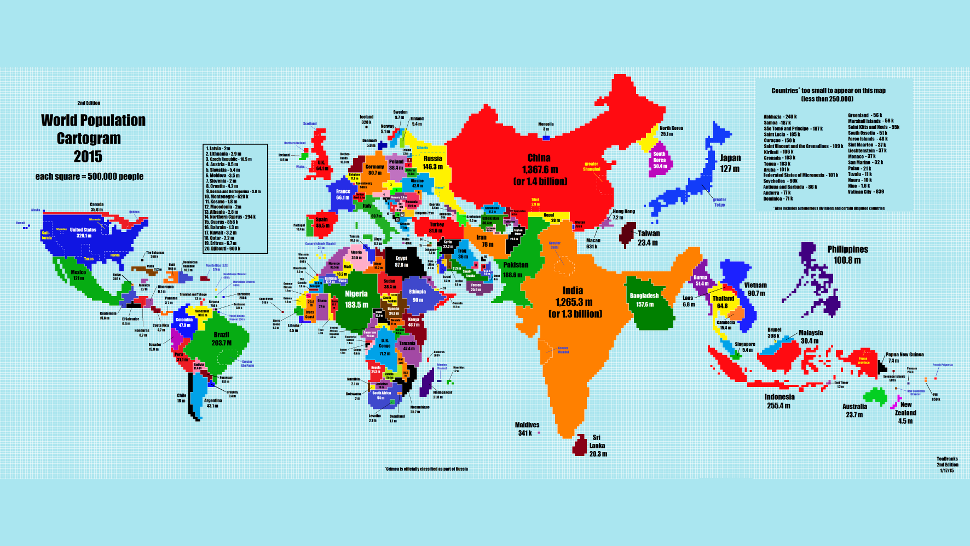
what the world would look like if countries were scaled by population
data visualizations
demography
maps
population
science
science fiction
visualizations
source
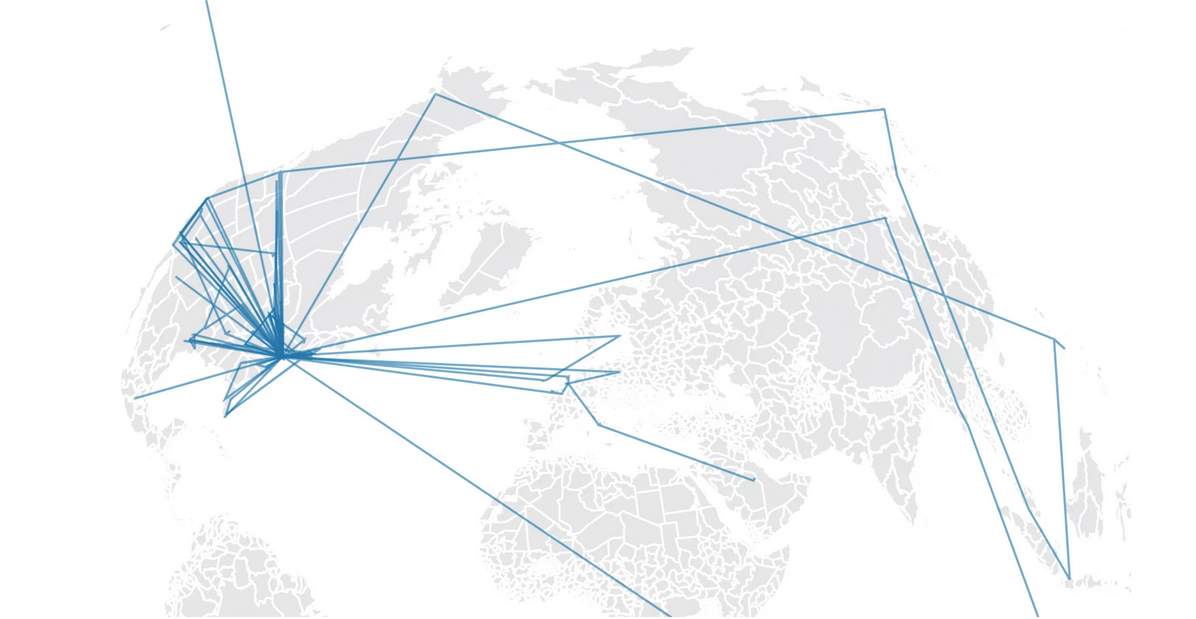
a year of presidential travel, mapped
data
maps
obama
technology
travel
visualizations
source
this site visualizes your death
benedikt groß
charts
infographic of the day
infographics
population.io
technology
visualizations
source
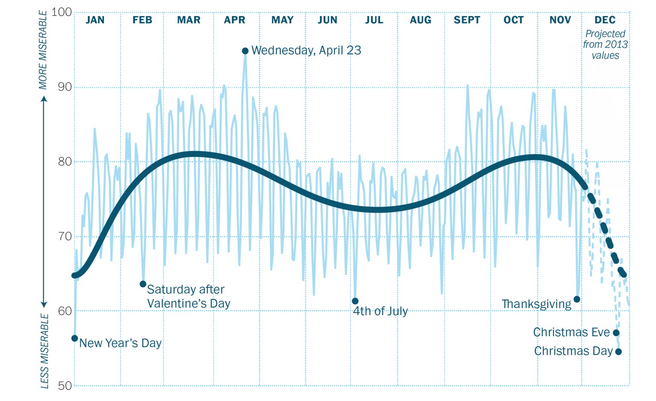
charts show when we're at our most miserable during the year
misery
data
data visualization
google trends
graphs
happiness
misery index
science
science fiction
trends
visualizations
source
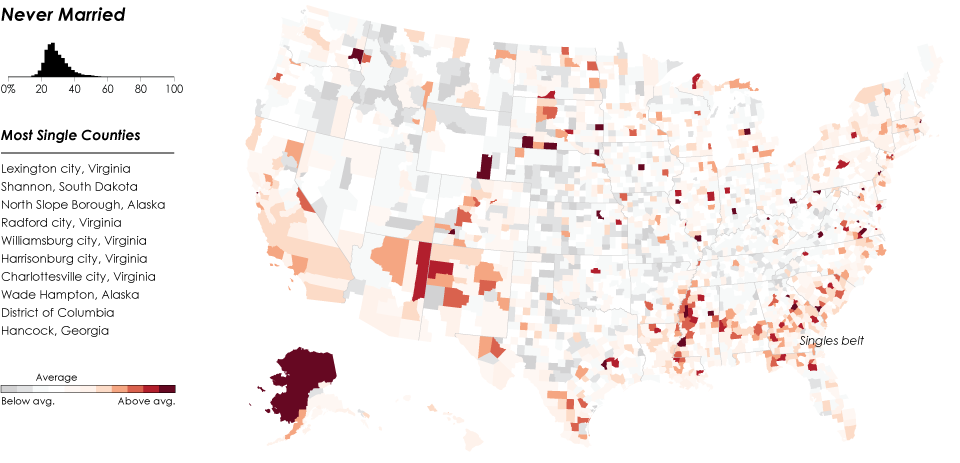
the relationship status of the u.s., visualized
data
maps
relationships
technology
visualizations
source
the history of the english language in one chart
english
english language
history
language
science fiction
visualizations
source
billboard's top songs of the past 5 decades, visualized
billboard charts
billboard hot 100
design
flowing data
graphic design
history
infographic of the day
infographics
innovation
music
nathan yau
pop music
technology
visualizations
source
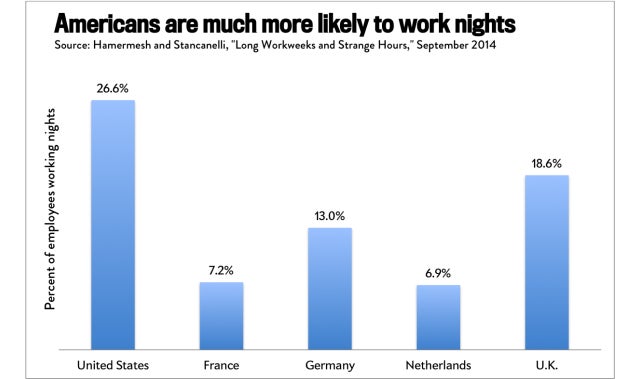
americans are more likely to work nights and weekends compared to citizens of other developed countr
american work habits
data visualization
overtime
science
science fiction
sociology
visualizations
work
work hours
source
these simple tips will make your science visualizations rock
charts
data visualization
graphs
plots
science
science fiction
scientific method
scientific visualizations
visualizations
source
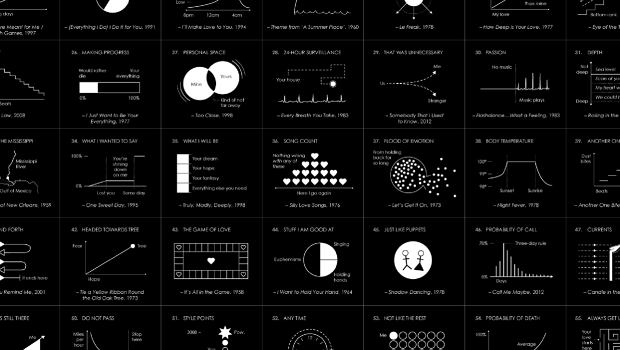
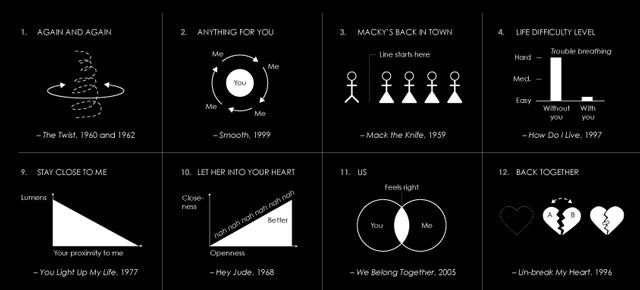
the top 100 songs of all time as graphs and diagrams
flowing data
music
songs
technology
visualizations
source
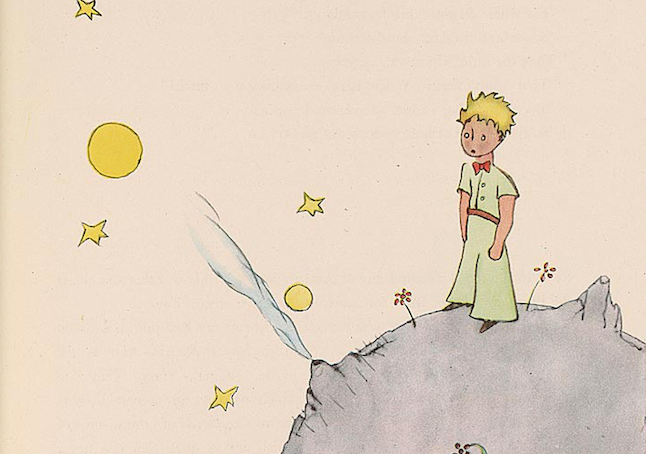
what book's artwork added the most to the story?
art
books
illustrations
open channel
science fiction
visualizations
source
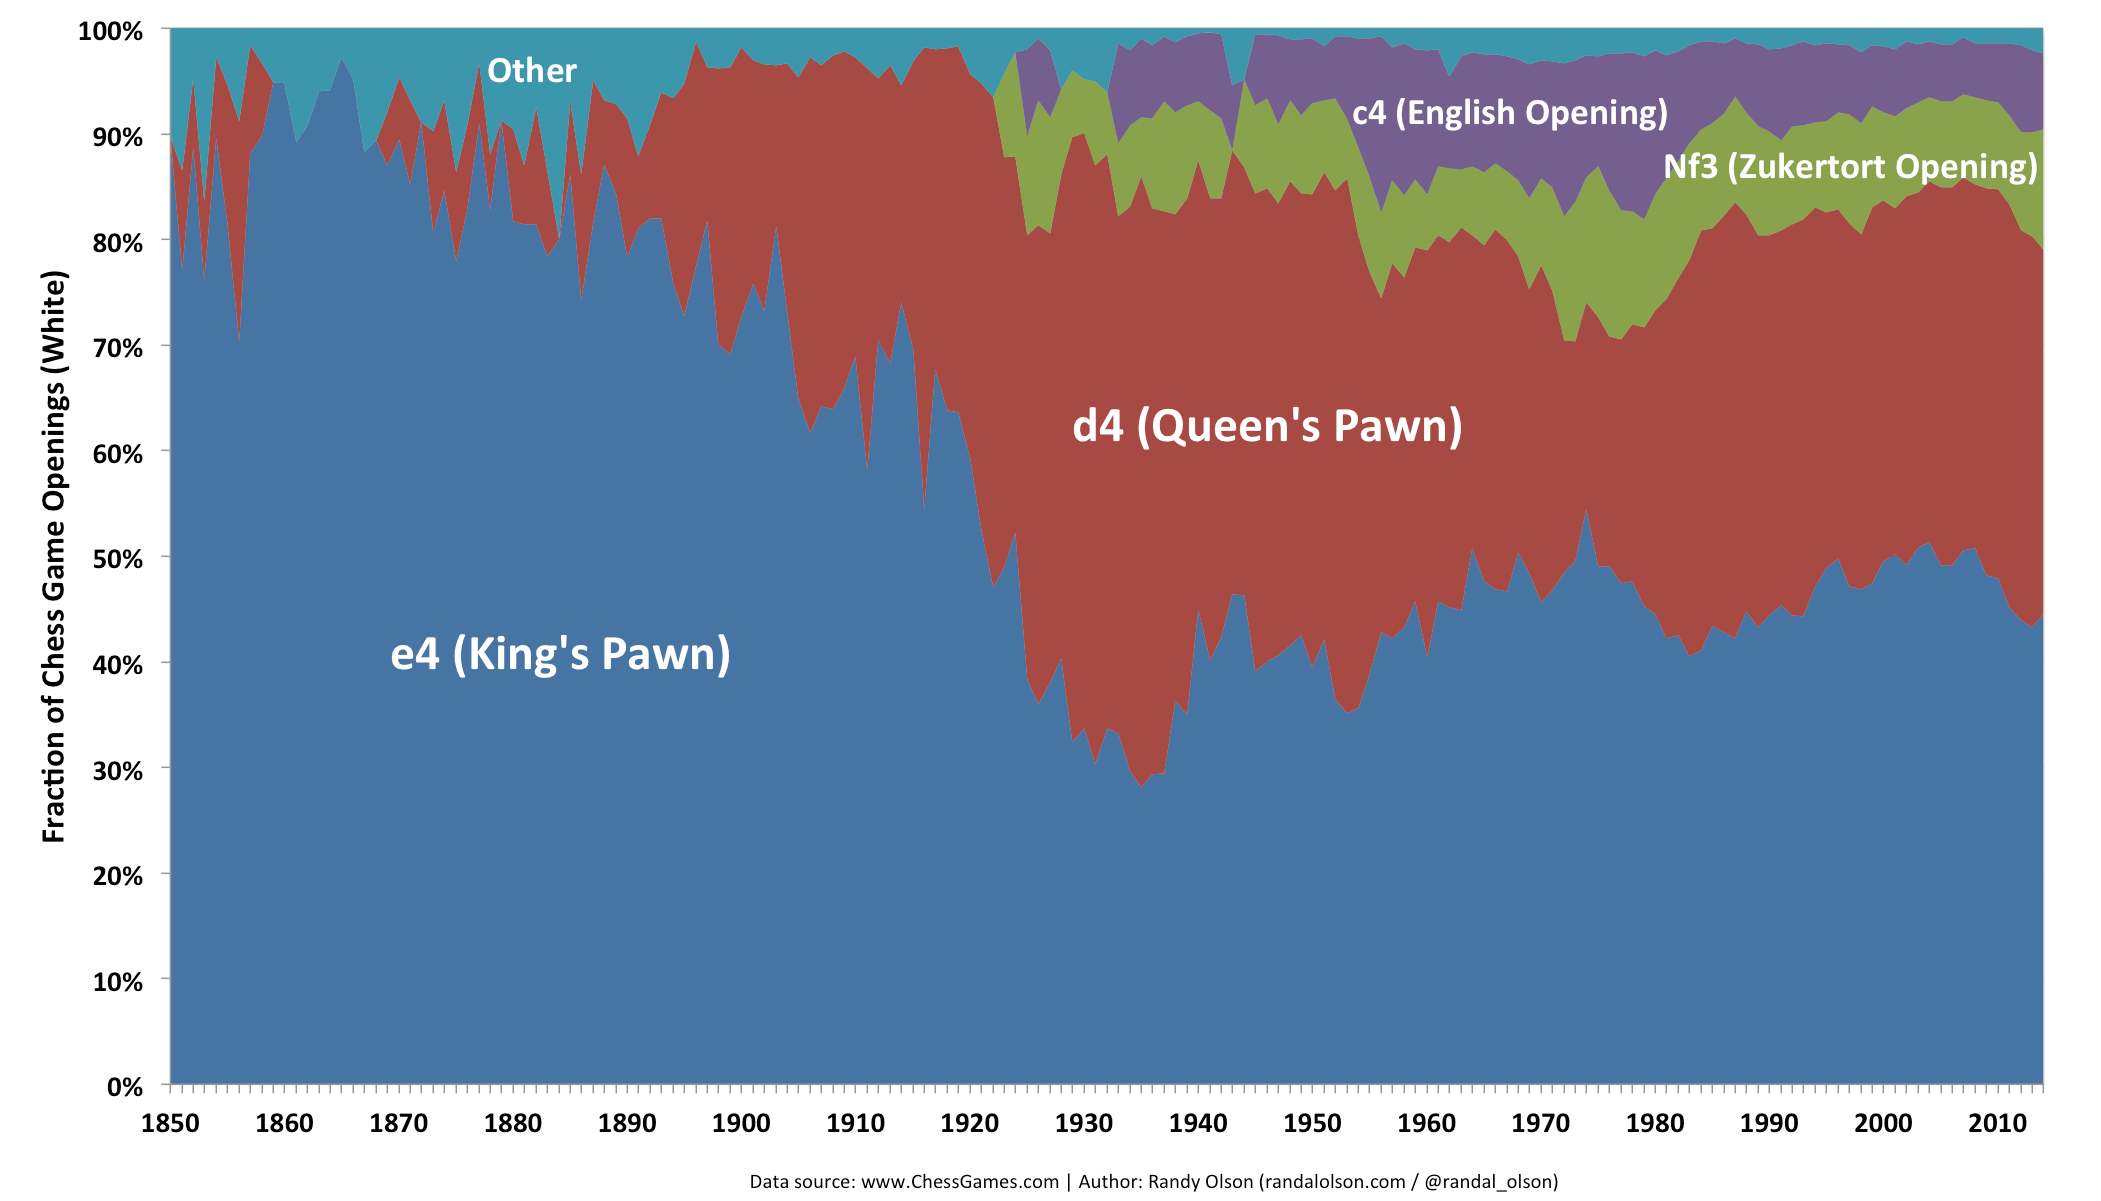
a visualization of popular opening chess moves over time
chess
games
science fiction
strategy
visualizations
source
an incredible way of visualizing music
george johnathan
interactive videos
music video
science fiction
this is awesome
visualizations
source
Show Previous
Show More