Trending Now
Recommended for you
0
Your favorites
0
About us
English
English
Español
中国
Log in with Facebook
Nothing found.
New recommendations for you:
Click on a
button to see recommendations based on your taste!
dear data postcard project: a hand-drawn personal data visualization correspondence exchange between artists giorgia lupi and stefanie posavec
artbooks
books
datavisualization
deardata
design
drawings
giorgialupi
magazine
moma
postcards
stefanieposavec
source
link about it: what is modern art's favorite color?
art
culture
datavisualization
linkaboutit
magazine
modernart
research
source
how does genre affect popular musicians' life expectancy?
datavisualization
health
longevity
mortality
music
public health
science
science fiction
sociology
source
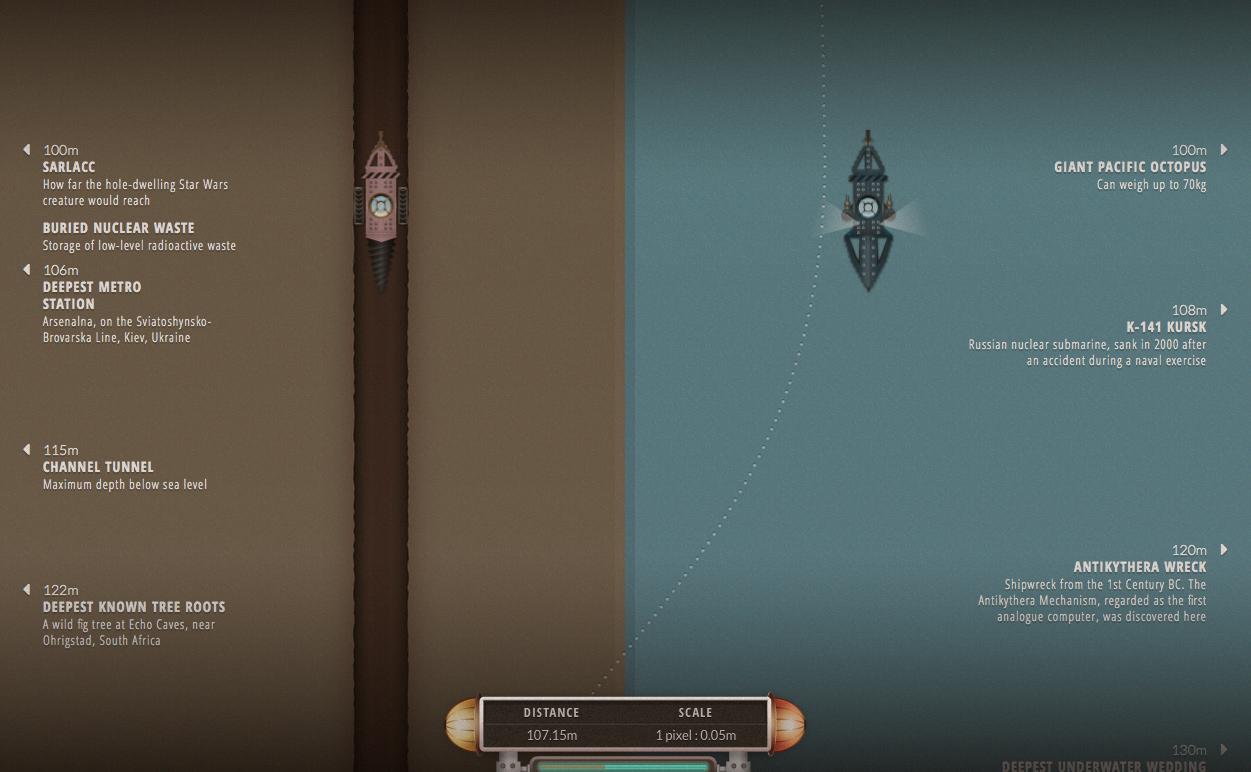
this is what it would be like to dig to the center of the earth
datavisualization
dataviz
geology
science fiction
source
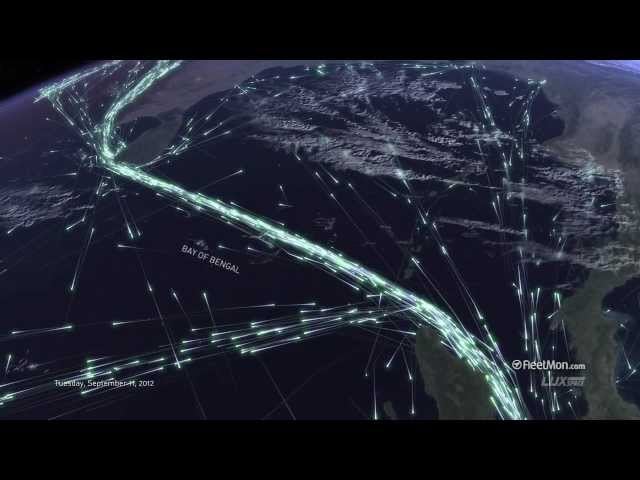
this map of a week's worth of global shipping traffic is mesmerizing
datavisualization
dataviz
maps
science fiction
shipping
source
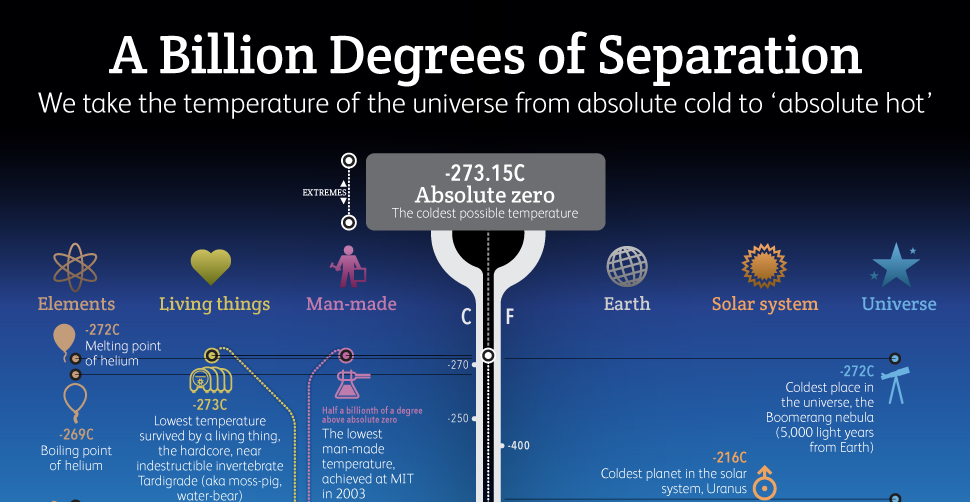
the hottest and coldest temperatures allowed by conventional physics
absolute hot
absolute zero
datavisualization
geoscience
infographics
physics
science
science fiction
source
best of ch 2014: data visualization: an interactive data graphic explores how our content connected last year across categories and keywords
bestofch2014
data
datavisualization
interactive
interviews
magazine
nyc
quantified
tech
source
the hidden patterns created by animals in flight
chart porn
datavisualization
design
eleanor lutz
flight kinematics
graphic design
infographic
science
science fiction
this is awesome
source
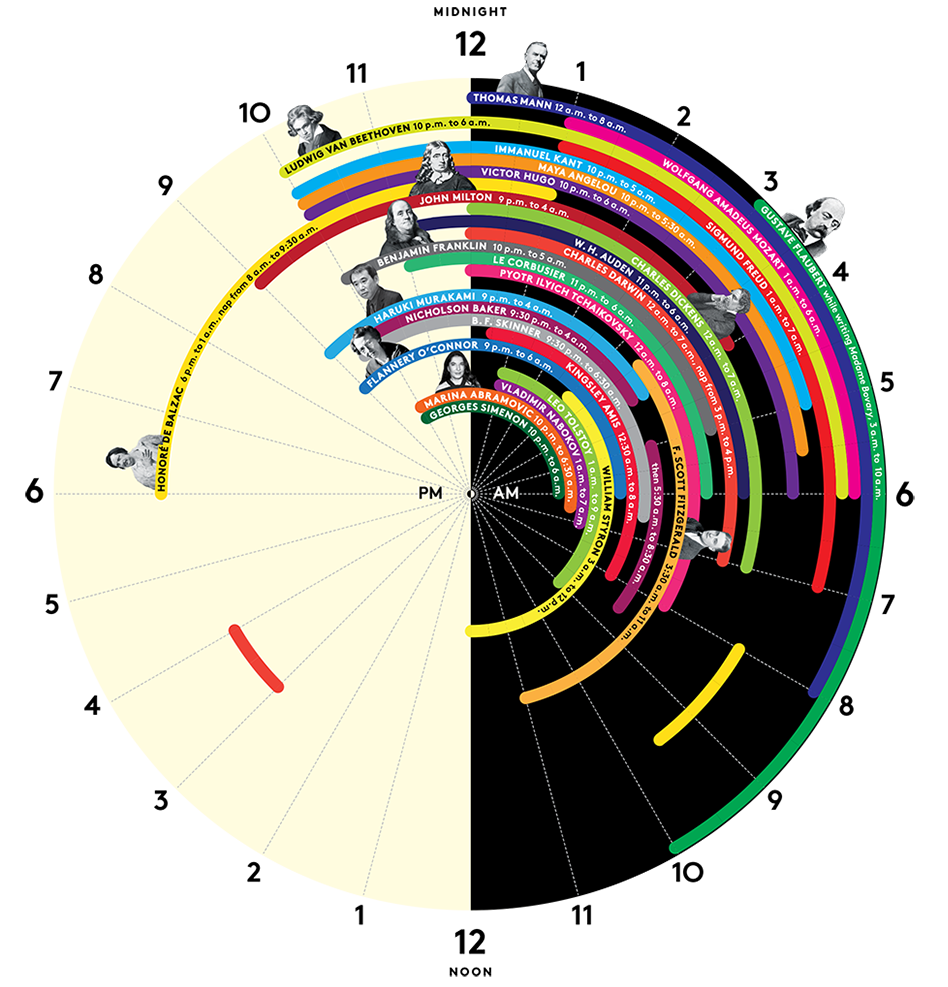
the sleep schedules of some of history's greatest minds
daily rituals
datavisualization
mason currey
science
science fiction
sleep
source
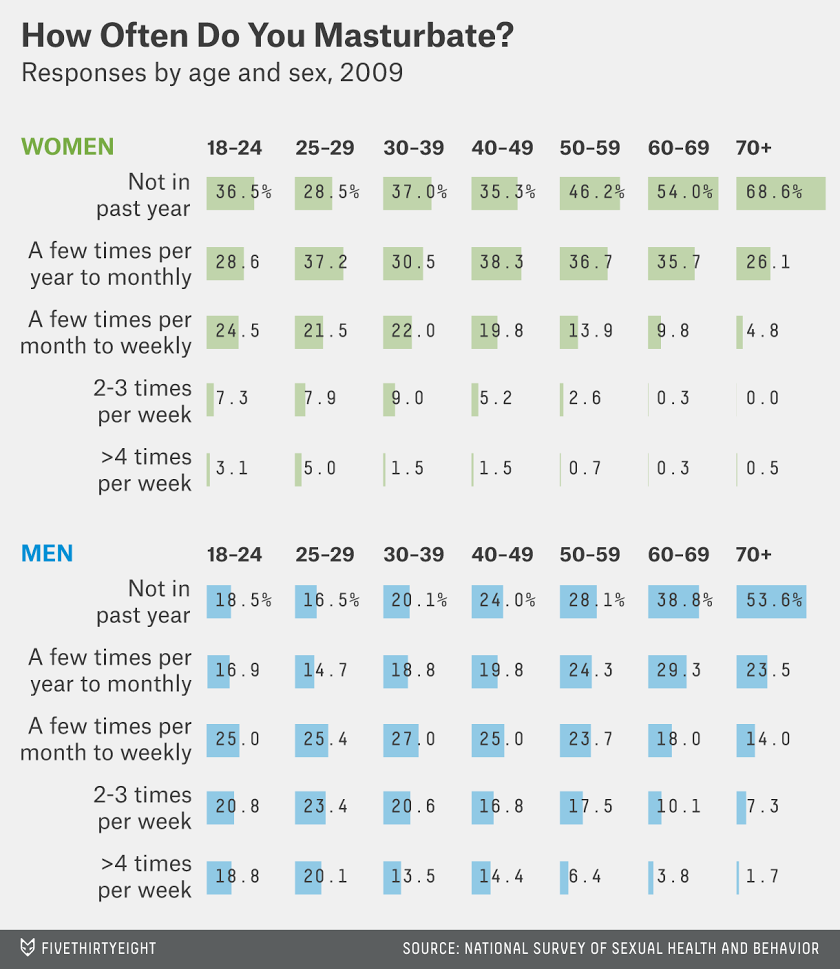
how often men and women masturbate, by age
datavisualization
masturbation
science
science fiction
sexology
source
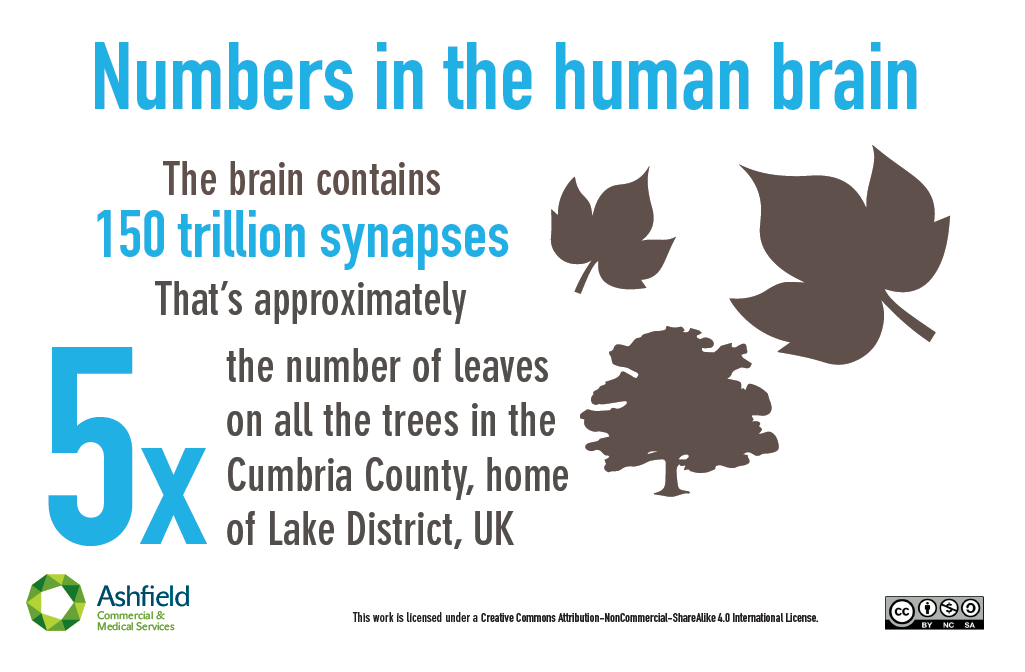
how big is the brain? here's some perspective.
ashfield
datavisualization
eyewire
fei
infographics
neuroscience
science
science fiction
visually
source
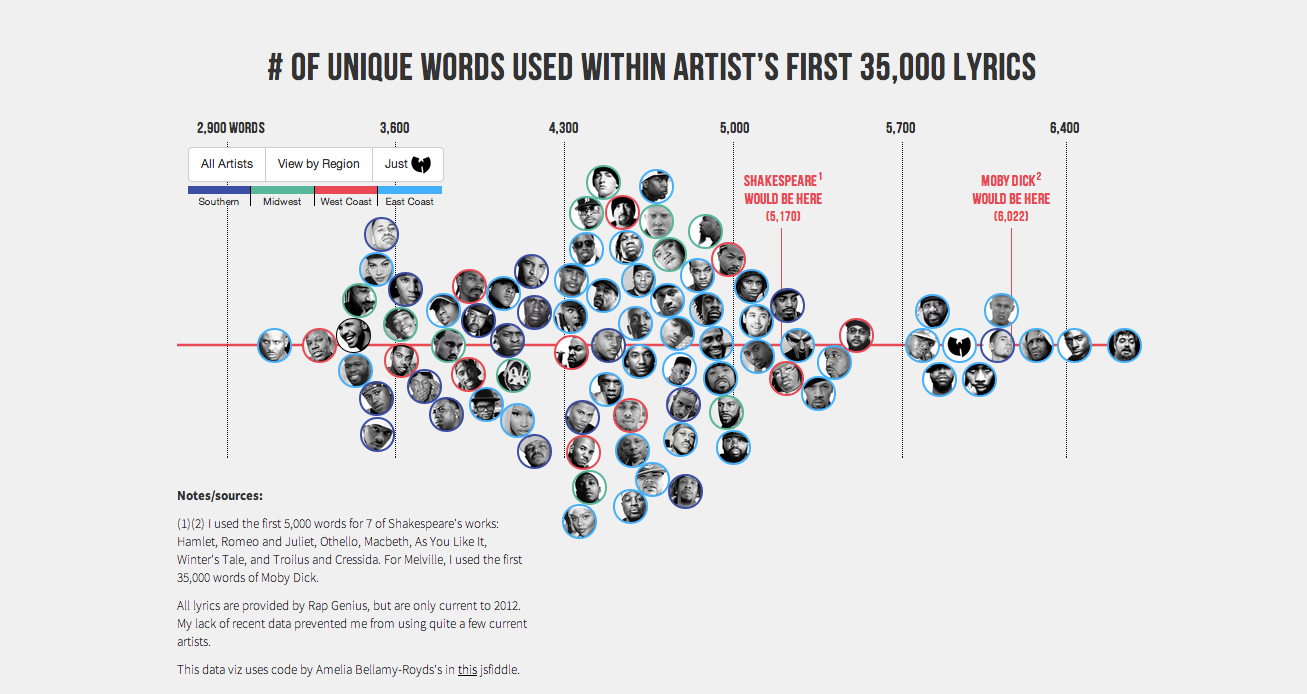
rappers, ranked by vocabulary-size
datavisualization
hip hop
maths
matt daniels
music
rap
science
science fiction
source
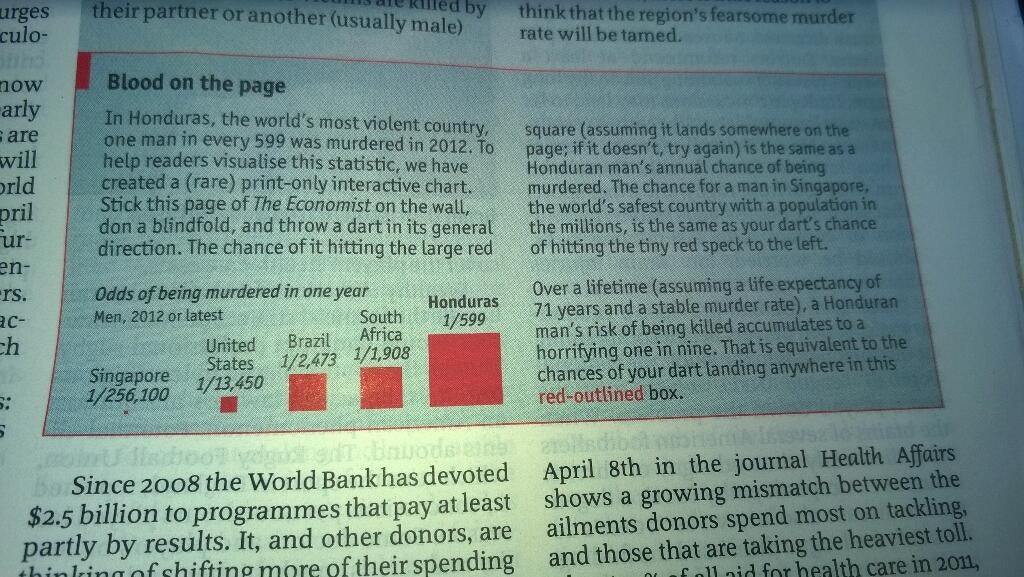
what's your risk of being murdered? find out with a game of darts.
charts
datavisualization
graphs
murder
science fiction
sociology
the economist
source
manuel lima: the book of trees: the data visualization master's new work gives a history and analysis of leafy diagrams
books
data
datavisualization
design
designbooks
infographics
magazine
visualizations
source
charged: afterguard: a heads-up display that streams live data for quick decision-making on the high seas
canada
cadillaccharged
datavisualization
gps
magazine
navigation
outdoors
sailing
sponsored
sports
tech
vancouverbc
wearabletechnology
source
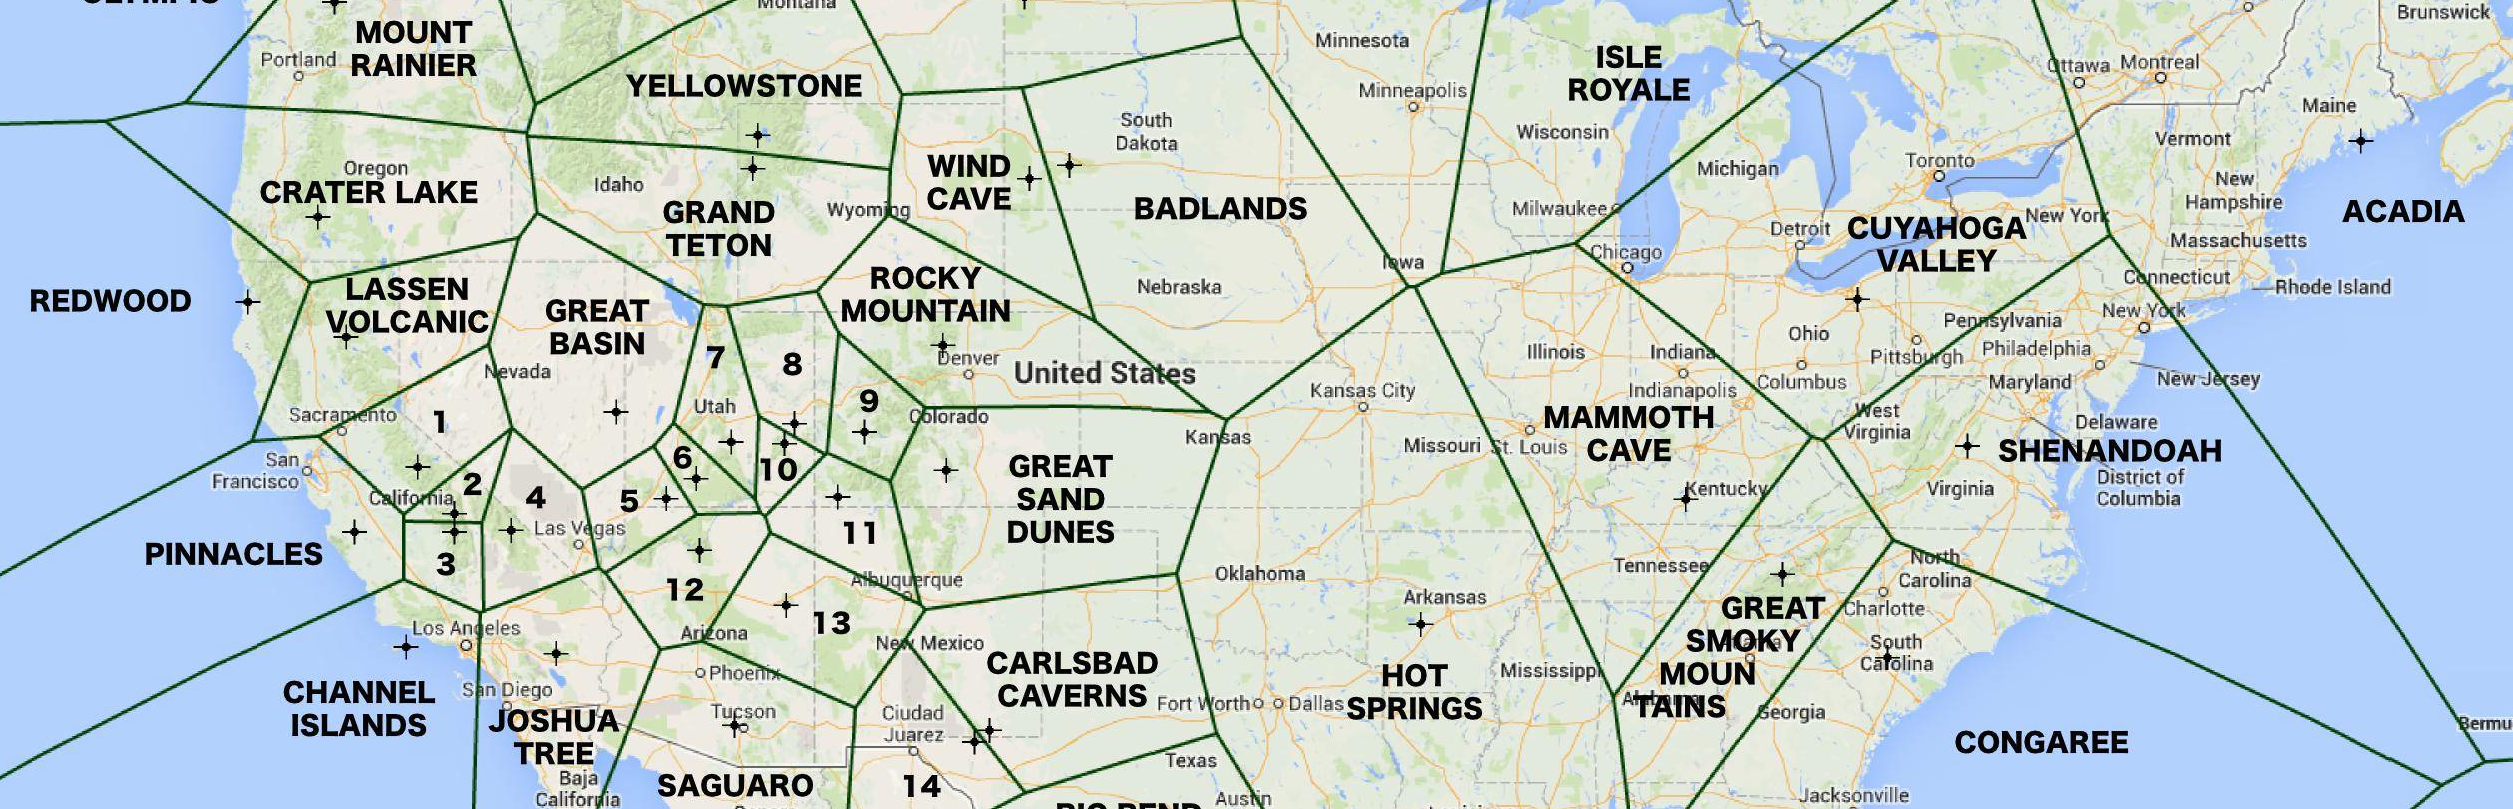
find the closest national park with this handy map
datavisualization
geography
maps
mathematics
maths
science
science fiction
voronoi diagram
wouj
source
Show Previous
Show More