Trending Now
Recommended for you
0
Your favorites
0
About us
English
English
Español
中国
Log in with Facebook
Nothing found.
New recommendations for you:
Click on a
button to see recommendations based on your taste!
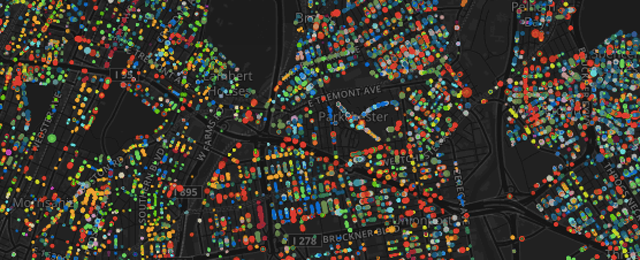
every tree in new york city, mapped by species
data viz
mapping
maps
technology
urban ecology
source
airport security raked in nearly $675,000 in loose change last year
data viz
tsa
source
watch how snowmageddon spread across twitter
data viz
infographic of the day
innovation
twitter
source
daily kos elections morning digest: north carolina democrats get ready for another intense race
john carney
ak-gov
ak-sen
alan grayson
ami bera
amy klobuchar
ann kirkpatrick
anthony foxx
az-01
az-02
az-sen
beau biden
bernie herpin
bill walker
brad ashford
ca-07
ca-09
ca-16
ca-17
ca-26
ca-31
ca-52
carl demaio
charles meeker
chris coons
claire mccaskill
clint didier
co state senate
colin bonini
collin peterson
cory booker
dan newhouse
dan sullivan
daniel bongino
data viz
david schweikert
dc mayor
dccc
de-gov
dke daily digests
donna edwards
doug ose
dscc
ed gillespie
elizabeth warren
emanuel cleaver
fl-02
fl-18
george rivera
gwen graham
jared polis
jeff gorrell
jerry mcnerney
jim costa
jim himes
joe crowley
john delaney
john mccain
johnny tacherra
jon tester
joseph kennedy iii
julia brownley
ken simpler
kirsten gillibrand
leroy garcia
lois frankel
louise slaughter
mark assini
mark begich
mark warner
martha mcsally
md-06
michael bennet
michael merrifield
mike honda
mn-07
nc-gov
ne-02
nick casey
nita lowey
ny-25
pat mccrory
patrick murphy
paul chabot
pete aguilar
peter shumlin
politics
ro khanna
ron barber
roy cooper
scott milne
scott peters
sean parnell
seth moulton
sheldon whitehouse
steve israel
tom gordon
tony amador
va-sen
vt-gov
wa-04
source
artificial intelligence
mit visualizes what robots are thinking
robots
aerospace controls lab
ai
data visualization
data viz
drones
hud
infographics
innovation
interface
mit
motion tracking
nove
technology
ui
user experience
user interface
visualization
source
a trippy visualization of galaxies colliding
cosmos
data visualization
data viz
galaxies
gas
infographic of the day
infographics
innovation
nove
society
space
telescopes
universe
visualization
source
a disquieting map of gunshots heard around schools
guns
data visualization
data viz
infographic
infographic of the day
innovation
maps
technology
violence
source
the world's happiest places, visualized
data viz
infographic of the day
moritz stefaner
oecd
technology
source
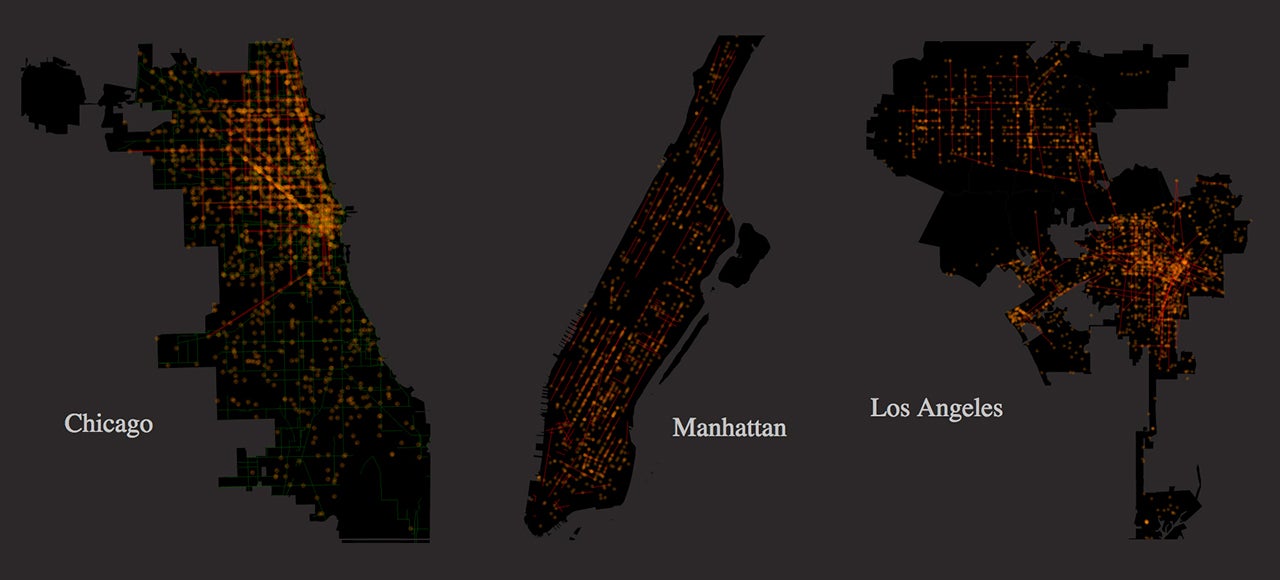
these are the streets you want to avoid when you're riding your bike
bicycle
bicycles
bicycling
bike month
bike safety
bikes
cycles
cycling
cyclists
data viz
technology
source
2,500 flaming gas burners make this one awesome audio visualizer
data viz
gas burner
music
newspaper
visualization
source
clever map reveals which cities get the best weather
data viz
technology
source
how long you have to work minimum wage for one beer, by country
beer
booze
data visualization
data viz
technology
work
source
this is what a computer sees when it watches the matrix
data viz
gallery
technology
source
this stunning data viz captures 200 years of oceanic exploration
ben schmidt
data viz
design
infographic of the day
moby dick
ocean
shipping
technology
source
a cheat sheet for the next 100 quintillion years
data viz
technology
the future
source
this awesome interactive map shows github as a sprawling city
data viz
design
technology
source
Show Previous
Show More